Introducing Kube Carbon
Ever wonder what kind of carbon foot print your cloud computing software is producing? What kind of improvement could you have by moving your workload from one zone to another? What about scaling to 0, how does that help? While much of this is heavily dependent on the physical characteristics of the data center I wanted to see if I could take a shot at estimating this in a way that leverages metrics produced by Kubernetes, and what limited data I could find from cloud providers.
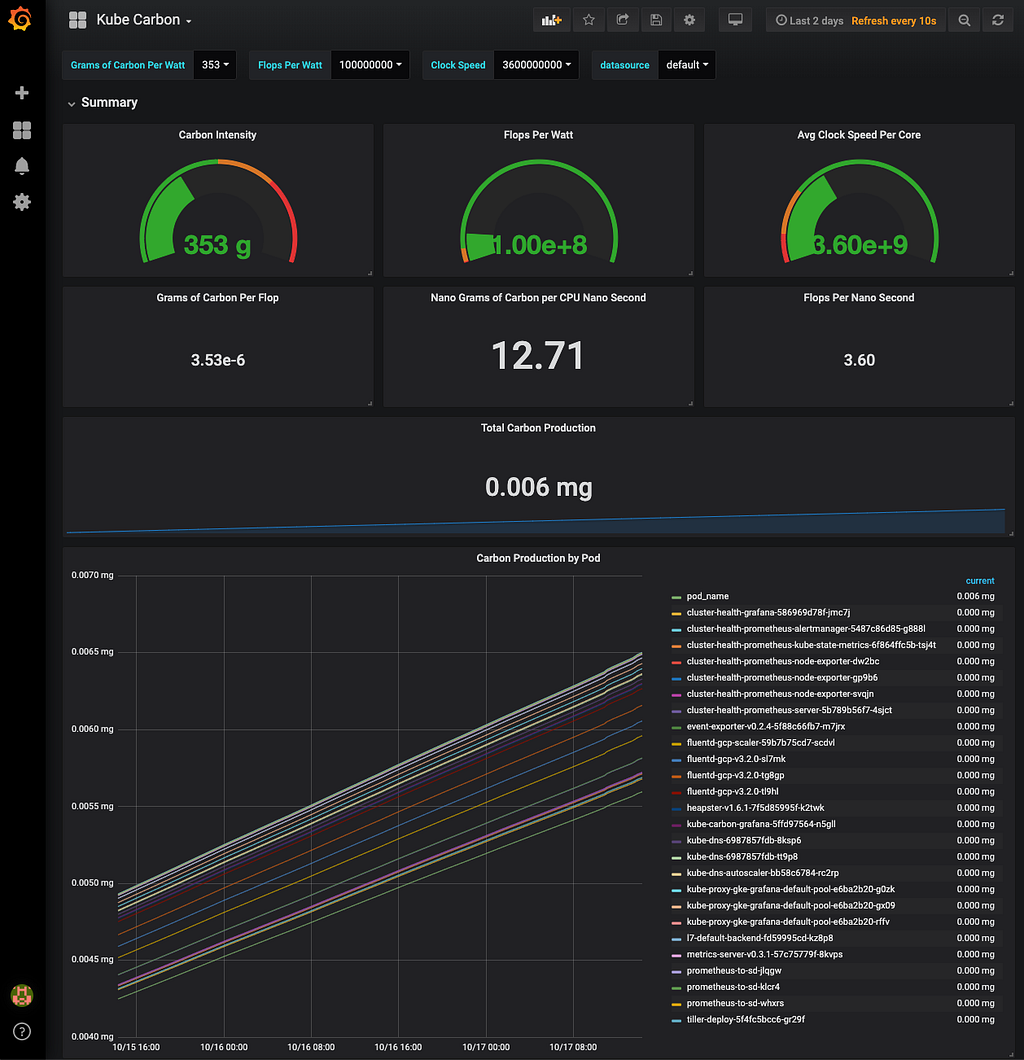
The result is a simple Grafana dashboard with the aim to increase consciousness around cloud carbon consumption.
Where is Cloud energy coming from?
Different forms of energy production have wildly different carbon intensity. This is usually calculated by determining the grams of carbon per kilowatt-hour of energy produced.
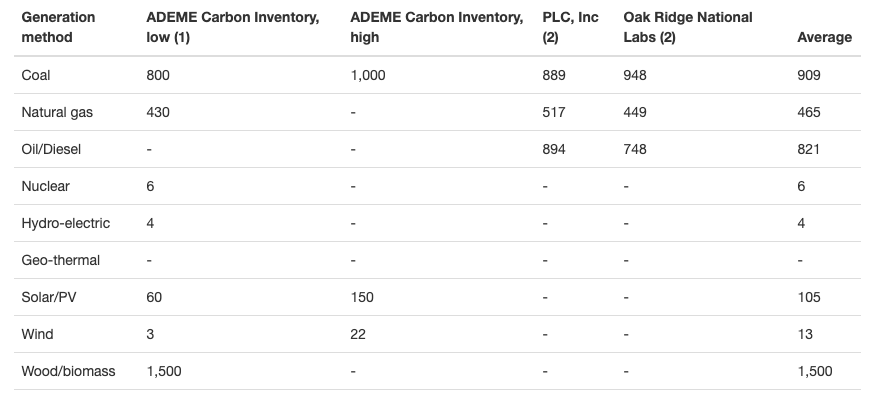
Carbon intensity from https://blueskymodel.org/kilowatt-hour
According to Jeff Barr’s outstanding post about AWS Cloud Computing Server Utilization Amazon had an average power mix of 393 grams of carbon per kWh back in 2015, which makes it slightly better than Natural Gas. Google Cloud purchases carbon offsets for all its energy consumption (which is admirable) but like with many things Google, there is no transparency around the actual carbon intensity of the energy used in their data centers. Microsoft has similar policies to Google in terms of offsetting carbon. Its disappointing that Jeff’s post on this subject is only real data out there.
Measuring Compute Efficiency
The second big factor in running a data center is how efficiently you are able to turn energy into cpu cycles offered to the user. This is not clear cut and Jeff’s post above makes a strong case that Amazon (and cloud providers generally) can probably do this better than anyone by doing it at scale. While Jeff takes a comparative approach I found it more helpful to look broadly at research as it pertains to Flops Per Watt which is the broadly the measurement used on everything from Smartphones to High Performance Computing. That said, I am not really sure what to expect out of a datacenter and included a wide variety of options.
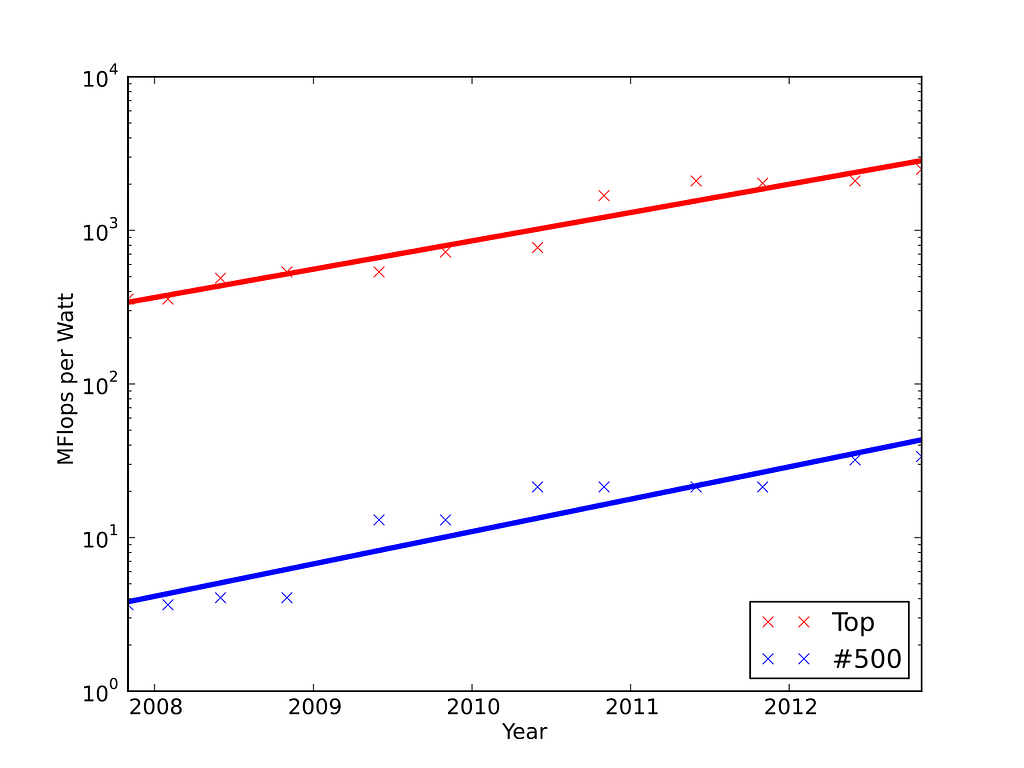
FLOPS per watt from https://en.wikipedia.org/wiki/Performance_per_watt
Bringing it all together in Grafana
I wanted to use these benchmarks together to allow Kubernetes users to estimate the carbon footprint of their Kubernetes clusters and workloads running on them. Since each cloud provider and data center are different (and somewhat opaque at the moment) I allow the user to configure key variables for Carbon Per Watt and Flops per Watt.
A call for more transparency around carbon from cloud providers
I especially wanted to incorporate the ability for users to look at the difference of running their workloads in different configurations and starting asking their cloud providers for more transparency. As the “Cloud Wars” drive more innovation and products to enterprise customers, those customers need to start asking about the impact their compute decisions have on the planet. My hope is that one day users are actively choosing cloud providers, and even availability zones based on their carbon footprint.